PV Monitoring Platform
Plant management made effortless
A PV monitoring platform built on digital-twin tech, with an AI strategy engine and multi-dimensional analytics — turning plant telemetry, alarms, and revenue accounting into one effortless workflow.
Six capabilities
redefining PV plant management
A professional monitoring system that covers what most enterprise fleets need.
Plant digital twin
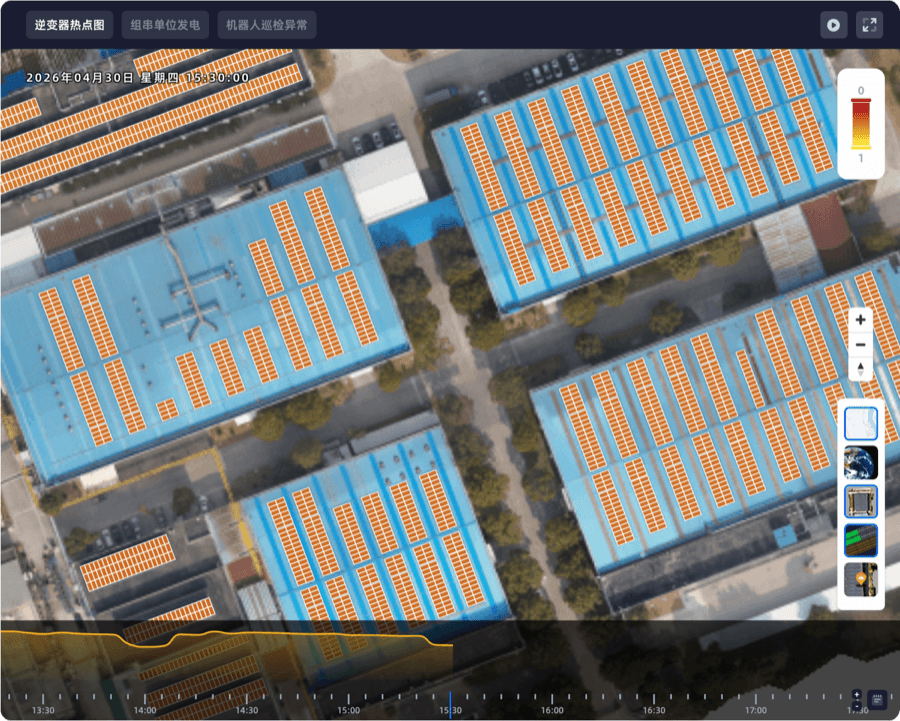
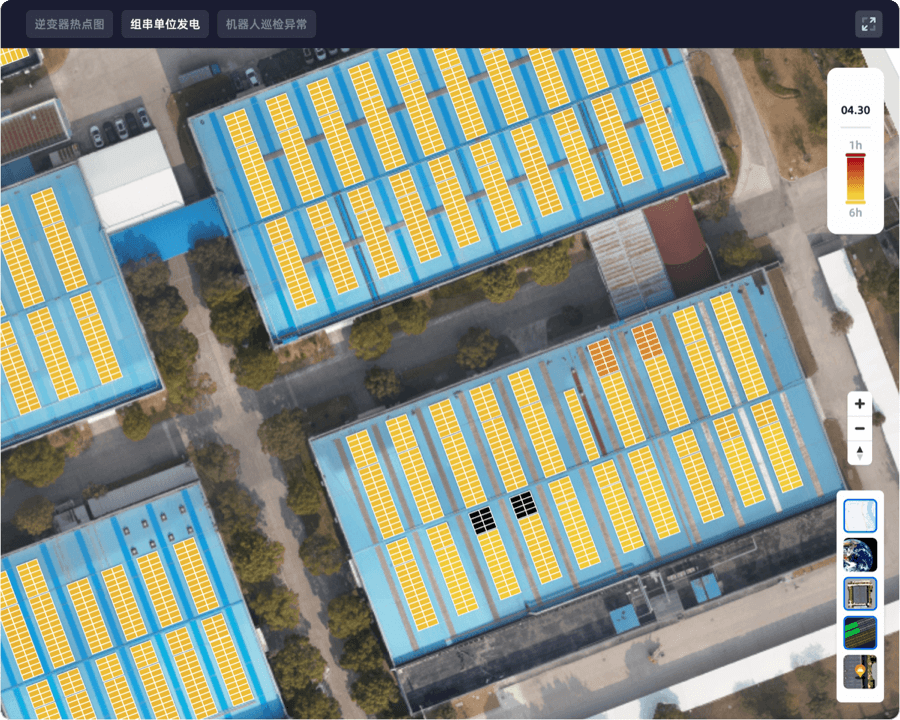
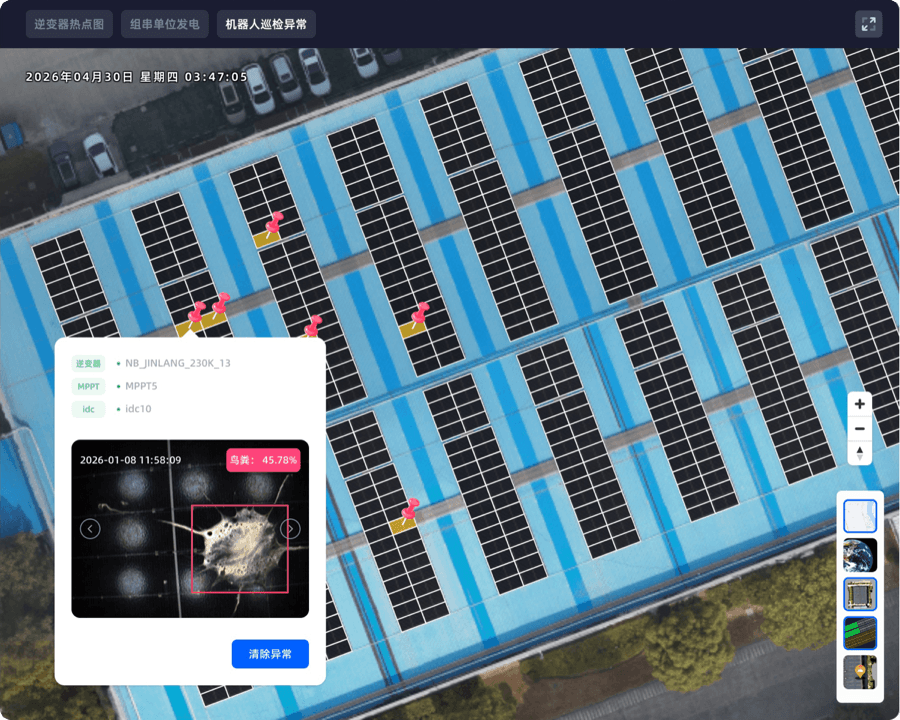
Module-level digital mapping + AI vision inspection. Three scenarios close the loop: (1) inverter heatmap pinpoints generation anomalies in seconds; (2) string-level yield benchmarking against orthophoto; (3) robot-mounted vision flags hotspots, microcracks, bird droppings, dust coverage — from 'pinpoint anomaly' to 'recognize at a glance'.
- Inverter heatmap
- String-level yield
- Robot anomaly inspection
- Module-level mapping
- Coverage / anomaly viz
- Orthophoto overlay
Plant digital twin
Module-level digital mapping + AI vision inspection. Three scenarios close the loop: (1) inverter heatmap pinpoints generation anomalies in seconds; (2) string-level yield benchmarking against orthophoto; (3) robot-mounted vision flags hotspots, microcracks, bird droppings, dust coverage — from 'pinpoint anomaly' to 'recognize at a glance'.
Proactive analysis
AI models and rules tuned to real operating needs. Multi-dimensional, deep data analysis profiles and evaluates both sites and devices.
Total revenue control, zero settlement friction
End-to-end coverage from bill creation, approval, invoicing and sealing through to collection. Multiple settlement templates match every contract type, keeping every kWh auditable and compliant.
Robot cleaning paths
High-precision sensors and smart routing draw the robot's path across the site in real time. Coverage, completed area, and pending area are all visible — clean work stays efficient and complete.
Tariff management
Centrally maintain tariff parameters, settlement modes and time-of-use rules across every site. Parameter changes one-click recalculate historical bills, keeping settlement data accurate, compliant, and ready for revenue audits.
Profit overview
The cockpit for portfolio revenue and cash operations. Aggregates revenue, settlement, collection and aging across every site so management can read asset health, spot cash risk and tune investment decisions at a glance.
From fleet overview to single-plant drill-down
Your whole portfolio in one cockpit
- Live capacity & generation roll-up
- Portfolio revenue & collection at a glance
- Cross-plant graded alarm aggregation
- Distribution & variance by province / county
Drill into one plant, read every curve
- Live power curve & today's output
- Inverter running status
- String-level current/voltage & mismatch detection
- Gateway meter & grid-connection metering
- Pyranometer & environmental monitoring
Both tiers share one data foundation — spot an anomaly in the overview, drill to the plant in one click.
End-to-end monitoring architecture
From the device terminal up to the dashboard, every layer is built or deeply adapted by Zenergy.
Presentation layer
Processing layer
Ingestion layer
Device layer
Frequently asked questions
Platform selection & compatibility, fleet overview, and single-plant monitoring.
01How does ZenovaOS use its AI agent to improve O&M efficiency for distributed PV plants?
02How is ZenovaOS different from vendor-owned clouds like Huawei FusionSolar or Sungrow iSolarCloud?
03What plant scales is ZenovaOS suited for?
04What modules does the multi-plant overview include?
05Why do multi-site owners need a unified overview instead of per-vendor clouds?
06What data can the single-plant monitoring view show?
07How does it tell whether a generation dip is weather or a fault?
Start with a single scene
Let AI enter the workflow
Best first plays: alarm triage, trend analysis, weekly/monthly auto-reports — all three deliver results within 14 days.